Footfall Attribution
Real-World
Impact Module
Know who visited because of your ads —not just who saw them.
Measure real-world impact and incremental lift.
Footfall Attribution
Measure real-world impact and incremental lift.

Connect ad exposure (online or OOH) to real store visits.

Separate organic from ad-driven visits.

Demographics, dwell time, cross-shopping behavior.

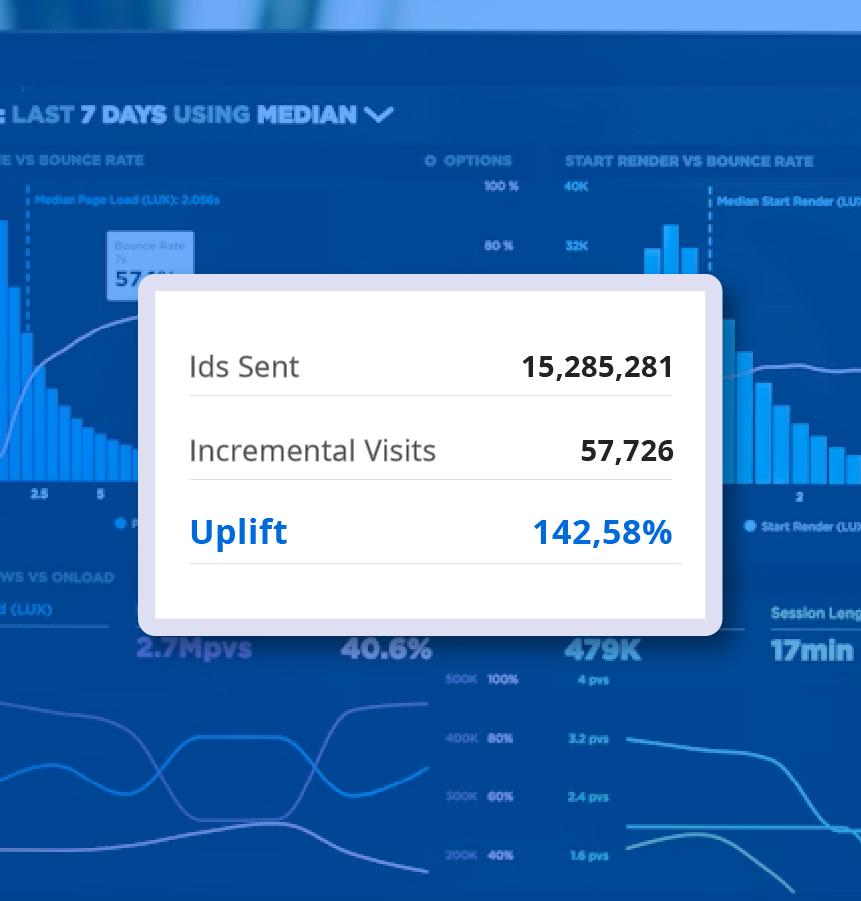
Run digitally through DSPs and Networks. We ingest the list of device IDs (MAIDs) exposed to your ads and track their subsequent journey to your stores.
Impression & Click Tracking
Cross-Device Matching
Attribution Windows (7-30 days)

Measure billboards, screens, and mupis. We identify users exposed to your OOH assets based on location and timeframe, then track their conversion to store visits.
GPS-Based Exposure Zones
Viewability Filtering
Real-World Journey Mapping

Users confirmed to have seen the ad (Online) or passed the OOH asset (Offline).

A "lookalike" audience with identical traits and location history who did not see the ad.

The difference in visit behavior between the two groups represents the Incremental Visits generated purely by the campaign.
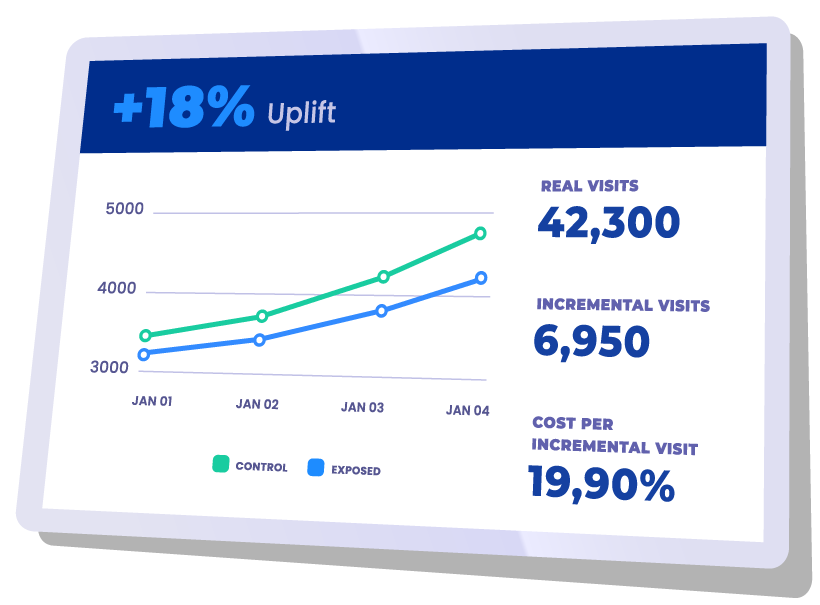
Understand the visits generated because of your ads—and the real cost of driving a physical visit.

Conversion Rate:
Impacted IDs vs Store Visits.

Incremental Lift:
Store visits driven purely by your campaign.

Cost Per Incremental Visit:
Real-world CPA based on verified footfall.
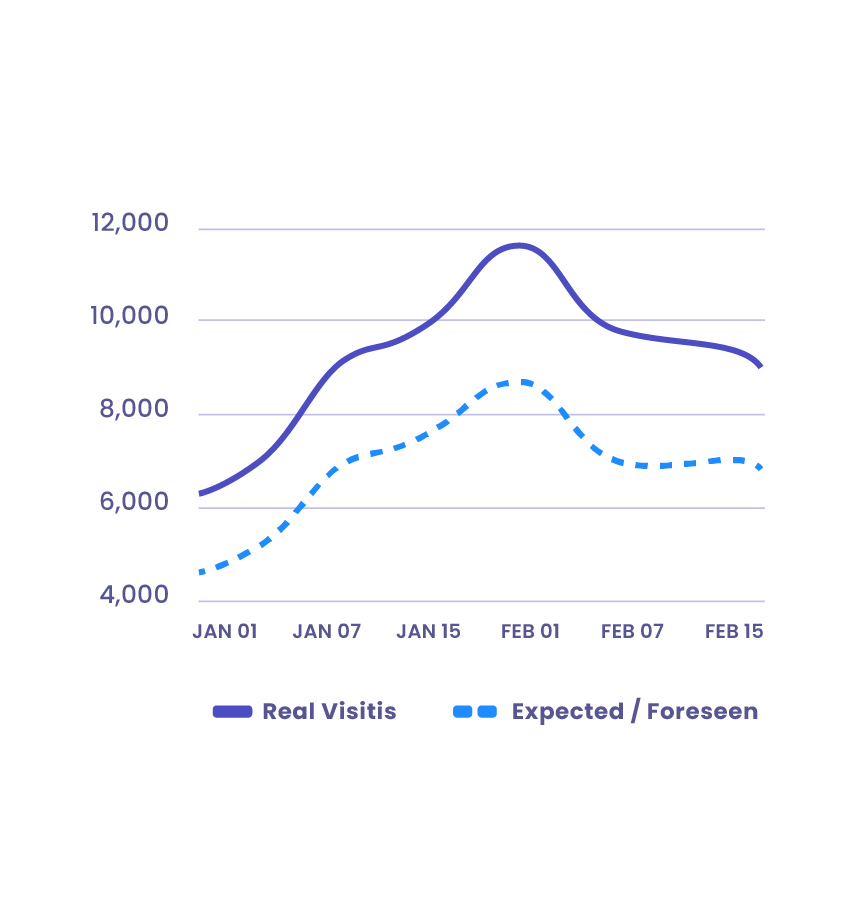
Visualize the "Geolift" effect. We plot Real Visits against Expected (Organic) baselines and Control Groups over time. The discrepancy between the expected and real values after the campaign starts indicates the true campaign effect.
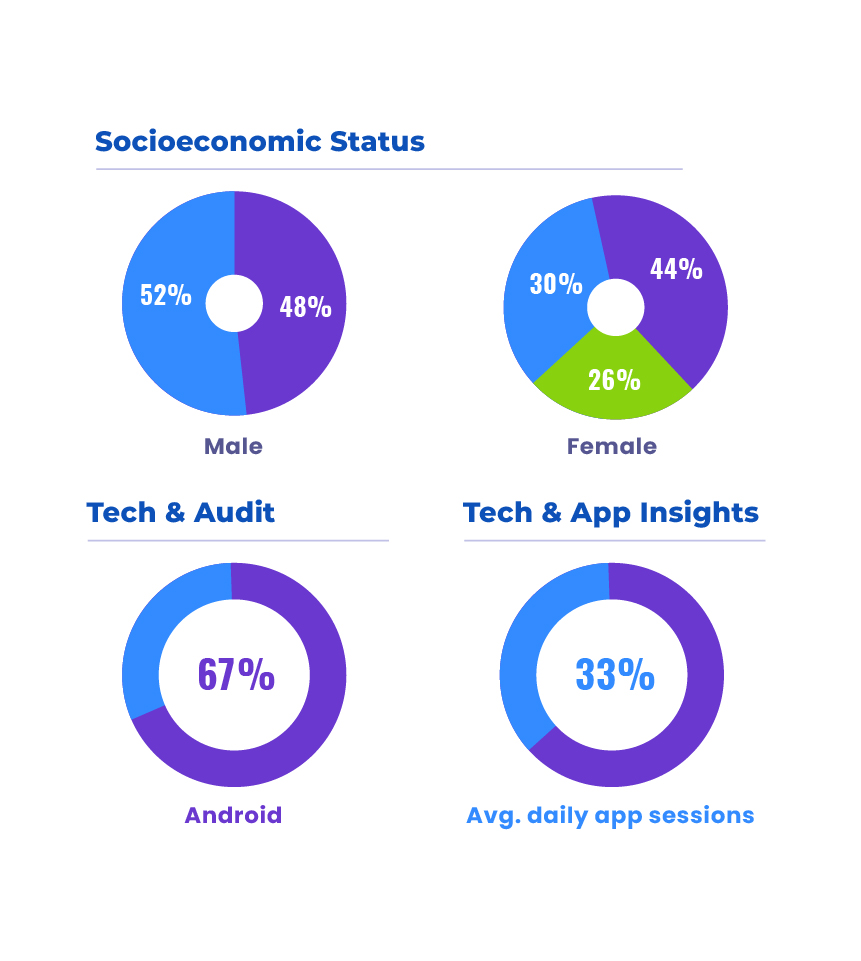
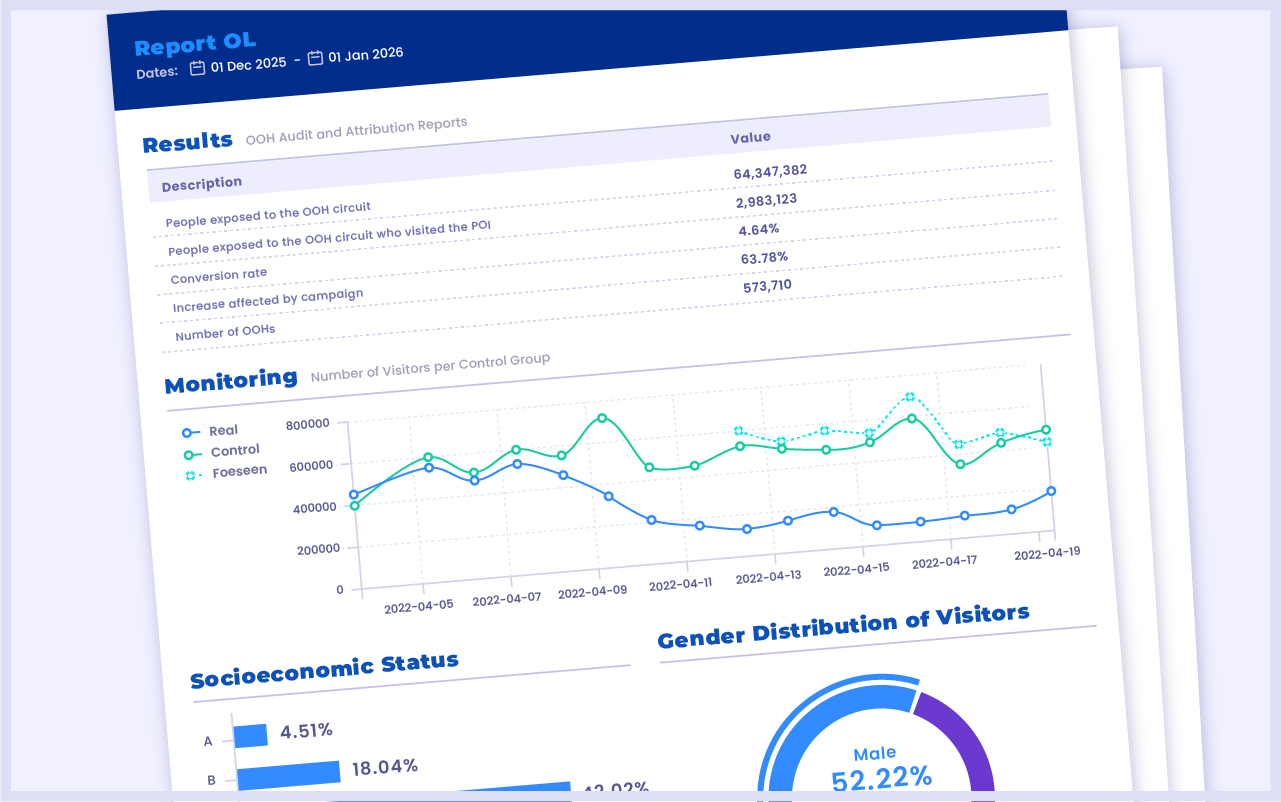
Knowing they visited is good. Knowing who they are is better. Our Audit Module analyzes the profile of your visitors.
Demographics
Age, Gender, & Socioeconomic Class (A-E).
Store Ranking
Identify your top performing locations.
Customer Journey
Distance from home/work & cross-shopping behavior.
Tech Audit
Device brand and connection type analysis.

Shift spend to the OOH locations and DSPs actually driving foot traffic.
Validate agency performance with transparent, third-party data.
Fully aggregated and anonymized data processing compliant with privacy standards.